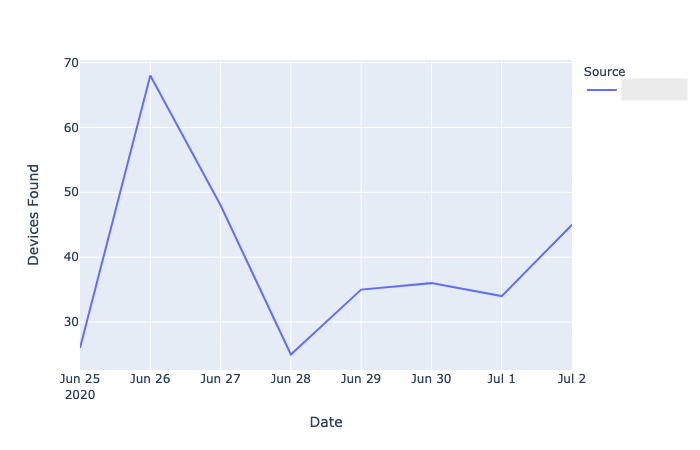
Dashboard
Databat’s dashboard provides you with a bird’s eye view, allowing you to view a glimpse of your foot traffic flow in seconds. We also provide you with insights on current visitor density compared to historical data points.
This dashboard allows a store manager or a marketing team to quickly understand developments over time in your foot traffic flow.
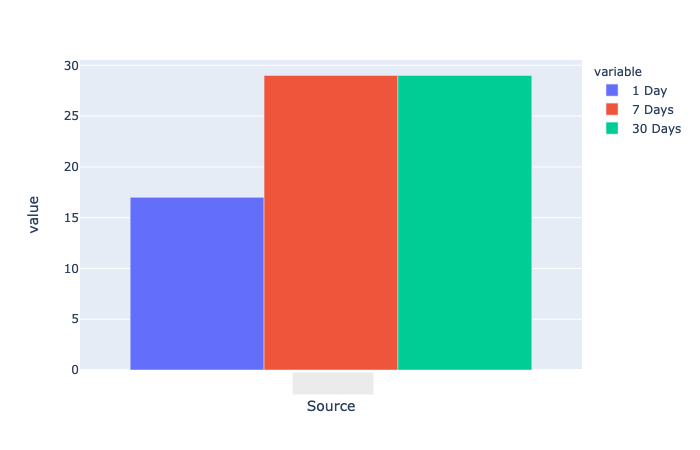
Reports
With the reporting tool, you are able to slice and dice the data as you see fit. You can look at reports, including:
- Daily
- Weekly
- Monthly
- Yearly
The reports can also compare and contrast recent and historical data.
Databat allows you to export this data to a spreadsheet so that you can perform even deeper analysis.
Insights
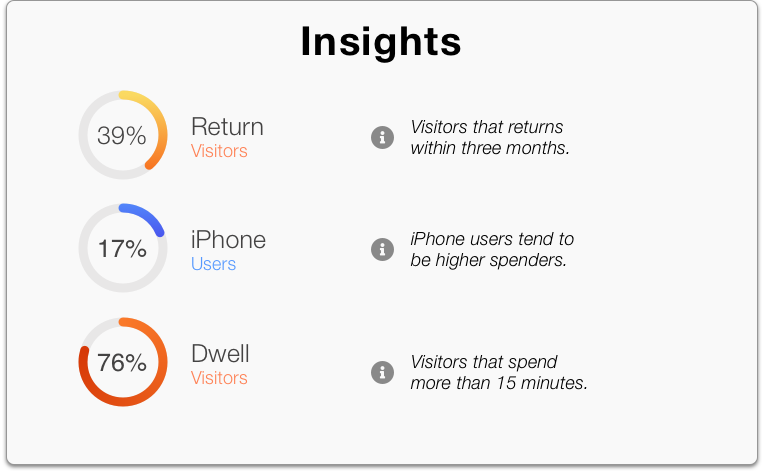
Insights, as the name implies, provides you with useful findings based on the data. We can provide you with data about your visitors, such as how many actually stop and look. We can also tell you how many of your visitors returned in the last three months.
In addition, Databat is also able to provide you with insights on who your users are. For instance, iPhone users are known to be higher spenders, which is a useful metric for retail environments.